Resticdash
ResticDash
AS OF 07-JAN-2026 this repository has been moved to ssh://git@git.kasisoft.com/daniel.kasmeroglu/resticdash.git
Motivation
restic itself is a popular backup tool which works pretty reliable and efficiently. I'm running several backups in my homelab on a time schedule. In general there shouldn't be any issue with that but how can I be sure?
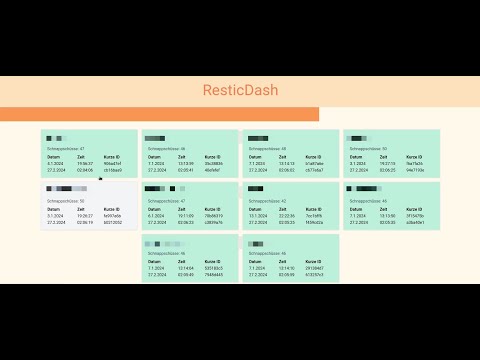
That's where this dashboard comes in. It's meant to visually show if a backup ran in a specified timeframe. If it ran it's green and otherwise it will simply be red, so I might need to check in on that.
Another reason for this dashboard is the fact that I like to dabble in other unfamiliar technologies as I'm primarily a Java/Kotlin/Spring dev. So this little dashboard serves as a useful playground and a way to practice other stuff.
A note of caution
I myself am neither a python nor a frontend developer. So the codebase is based upon a very small skillset.
Everything is based on Linux as it's meant to be used for myself. However I appreciate any kind of feedback to improve or fix my codebase.
The UI isn't very appealing as I clearly have no talent for visual stuff. Suggestions are welcome.
Project Walkthrouh
Repository Structure
This repository contains the following directories:
fs
This is a simple directory with several bash scripts used to setup some restic repositories which is useful for testing purposes.
Further information can be found here: README.md
backend
The backend has been written in python and provides a basic REST server as well as the frontend code.
Further information can be found here: README.md
frontend
The frontend has been written using svelte and especially Svelte 5 and it's runes which makes life for frontend developers much easier.
Further information can be found here: README.md
install
The install directory is just a collection of scripts and files allowing to configure a Linux service making use of this dashboard.
Further information can be found here: README.md
License
MIT © Kasisoft.com - daniel.kasmeroglu@kasisoft.com
Technologies
- arktype - Type specification and object validation. #arktype
- axios - HTTP Client #axios
- flask - Minimal HTTP server for Python #flask #python
- flowbite - tailwindcss based UI components #flowbite #tailwindcss
- pex - Bundler and launcher for python applications #python #pex
- pnpm - Package management alternative for frontends #pnpm
- python - Implementation language used for the backend #python
- restic - Backupsoftware written in Golang #restic
- resticpy - python wrapper for restic #python #restic
- svelte - Frontend framework #svelte #svelte5
- tailwindcss - Collection of systematically specific CSS classes #tailwindcss
- typescript - Typed extension to Javascript #typescript
- vite - Great build platform for frontend projects #vite
- yaml - Text based and well structured format #yaml
