Svelte ❤️ d3
Some people say they want to learn d3.js to do interactive visualizations.
Because who doesn't love this kind of stuff.
But d3 is kinda overkill. It does everything. And that makes it look scary.
In the last few years, dataviz heroes started to adopt a new way to use d3 captured by the following:
[!IMPORTANT] D3 for the data (aka for the maths and the paths), frameworks for the DOM (aka the rest)
The biggest advantage in my mind in following this advice is that it becomes clear what d3 is doing for charting and what other web technologies are doing for things like deployment, polishing, and interactive story telling.
It is not that interactive visualization is now easy. But the learning path of what to learn (and teach) becomes clearer!
Frameworks?
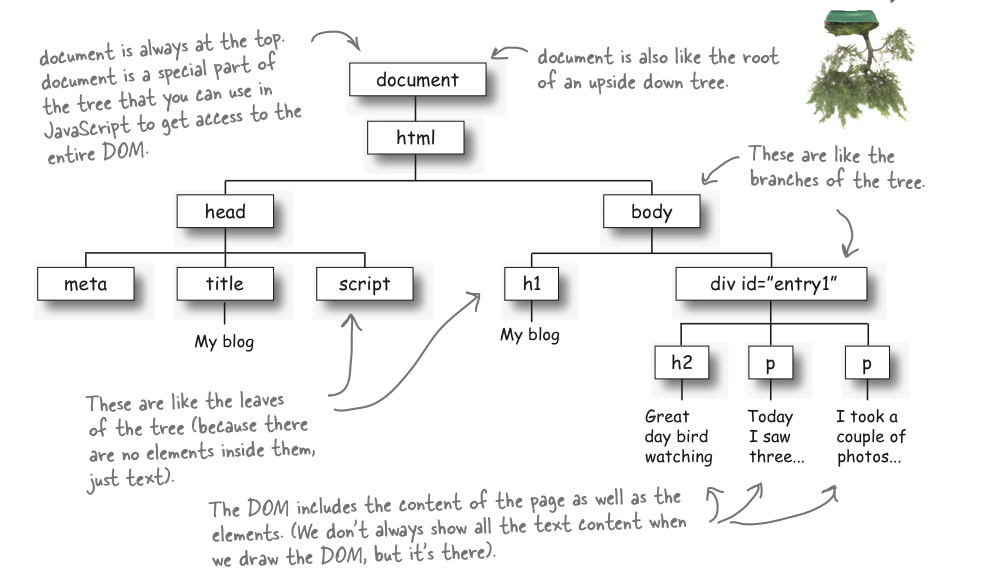
Wait, what does saying "frameworks for the DOM" means. The DOM is one of those thing we don't learn about in a science curriculum. But it is really fundamental to the web:
[!NOTE] Sure, imagine you have a big box of Lego blocks, and you want to build something with them, like a house. Each Lego block is like a part of a web page, such as a picture, some text, or a button. Now, think of the Document Object Model (DOM) as a special plan that tells you how to organize and play with these Lego blocks to build your house. It's like a map that shows you where each block should go and how they connect to make your house look just the way you want. So, when you want to change something in your Lego house, like adding a new window or removing a door, you use the plan (the DOM) to figure out which blocks to take out or put in. This plan makes it easy for you to build and change your Lego house, just like the DOM helps computer programs build and change web pages.
We care about the DOM because this is also our browser-friedndly drawing board. As we will see, one reason the Allotaxonometer project was so "easy" to implement in javascript was that I could easily access to the SVGs that was part of the DOM.
When we plot in Python, it becomes harder to draw directly on the browser because the browser don't speak python. There are ways around that, and stuff like jupyter-books or quarto are helping. But sometimes this is just not enough to have full interactive (more on that later).
Svelte is our framework
One last thing before moving on to the code, Svelte.
Svelte is new javascript library that recently took over React as framework of choice (if you know what that is). Most importantly for me, it is what the folks at the pudding.cool (and others!) are using at the moment.
The plan for today
- Building the
Allotaxonometerlive to demonstrate the approach (10mins max, if not I switch to the already built plot) - Making it interactive (this is where drawing directly on the DOM turns out be particularly useful; maybe 5-10mins?)
- Prototpying the allotax in a guided (scientific) exploration (we'll see how far we can go):
- What the confusing parts when learning about the allotax?
- Rank-rank plots?
- How the allotax represents types away from the diagonal propto divergence metrics, e.g. Jensen–Shannon divergence, Rank-turbulence divergence.
- The impact of parameter tuning on divergence contribution.
- etc...
- What the confusing parts when learning about the allotax?
- What we could polish ("early polishing is the root of all evil"; distinguishing between essential features of your story and the pretty stuff.)
References
I drew alot from Connor Rothschild's "How to learn d3 in 2023" blog post. But also see:
